More Work is Needed to Make Recycling Economically Sustainable

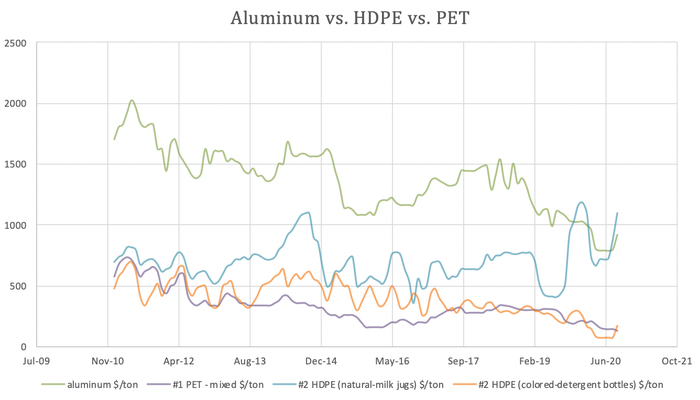
Quick quiz: what the most valuable item in your cart? If you said aluminum, you are not wrong. But depending on how you look at it, you are not right either. Once upon a time aluminum cans dominated the recycling cart. On a per ton basis, nothing event came close. It briefly touched $2000/ton. Aluminum cans were the most valuable thing in the recycling cart towering over all the other commodities and, as a result was the darling of recycling programs. Compared to fiber at $100/ton and plastic at $500/ton, nothing even came close to the commodity price of used beverage cans, or UBCs.
Containers are generally reported in cents per pound rather than the dollars per ton that I am using. However, fiber is reported in price per ton. Therefore, all information will be presented on a per ton basis to make it easier to compare. Also, bear in mind that commodity prices vary from coast to coast and state to state. Even region to region.
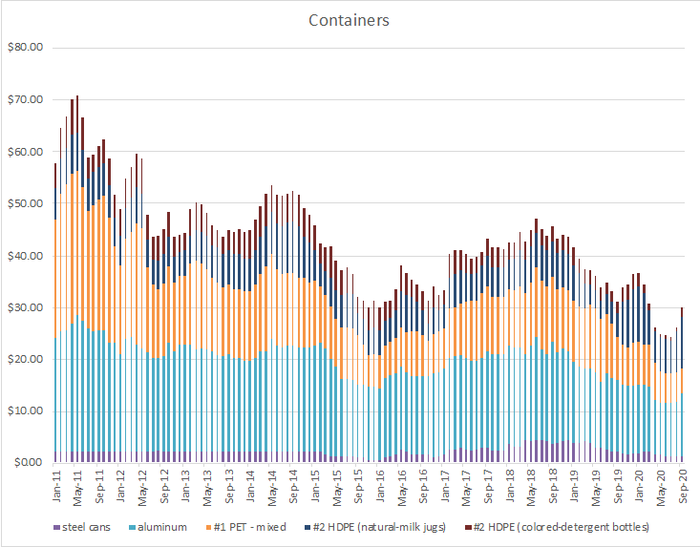
With that caveat, on a national basis, aluminum’s dominance changed this past winter when natural HDPE containers exceeded the value of aluminum cans for a few months. And, now, once again, natural HDPE containers are worth more than aluminum cans. This is the result of a steady erosion in the price of UBCs which has lost more than 50% of the value over the past decade. But it is also a result of some more recent increases in the price of natural HDPE containers.
Blended Value
Looking at pure commodity values may be interesting. But, ultimately how do these numbers support the blended value? The blended value is the combined value of all the materials in the cart – apportioned by the amount of each material. Therefore, in order to calculate the blended value, you need to know the makeup of your cart. Again, the breakdown of material in the bin varies from one area to the next, from one study to the next.
According to some reports, aluminum could be as low as 0.7% of the cart, or as high as 3.4% which is greater than a fivefold difference. While these quantities are small, due to the outsized influence aluminum cans traditionally have had, this could have significant effects on the blended value and ultimately, on the sustainability of the program.
For instance, in its second-quarter Report on Blended MRF Commodity Values in the Northeast, the Northeast Recycling Council (NERC) calculates the amount of UBCs leaving the MRFs are about 0.78%. However, in its 2020 State of Curbside Recycling Report, The Recycling Partnership (TRP) estimates that outbound tons of UBCs from MRFs are about 67% more than that at 1.3%. This emphasizes the importance of the proportional makeup of these materials in the bin. One reason for the difference might be that 5 out of the 11 states in the northeast represented by NERC have container deposits laws that might divert materials away from the curbside bin leading to lower quantities of deposit recyclables while TRP is presenting its figures from a national level.
So what is in a typical blend? The blend is dependent on numerous factors such as the acceptable materials list, regional variations, container deposit factors, and whether it is inbound or outbound or even at the point of generation. The table below shows a range and average mix for the blend. Because the average is the average of the range, it does not add up to 100%. As can be surmised, if a program does not accept glass, this could have a meaningful impact on the blend. And using the blend at point of generation does not account for contamination and as a result, all the numbers would be inflated.
Commodity | Range | Average |
|---|---|---|
Aluminum | 0.7 – 3.4% | 1.2% |
Steel | 1.8 – 3.0% | 2.2% |
PET | 0.9 - 8.3% | 3.7% |
HDPE Natural | 0.7 – 2.5% | 1.1% |
HDPE Color | 0.8 – 2.4% | 1.3% |
Cartons | 0.0 – 0.8% | 0.2% |
Glass | 14.6 – 28.0% | 21.5% |
Mixed paper | 20.4 – 42.0% | 32.2% |
OCC | 13.9 – 33.2% | 24.3% |
Residue | 9.9 – 19.0% | 13.6% |
From a valuation perspective, residue is always a negative value because it needs to be paid for. Other commodities may or may not have a negative value. Most frequently glass is negative. For most of 2019, mixed paper was also negative. Therefore, in order to determine what the most valuable item in the bin is, the commodity values must be weighted against the mix. (If Sally sold ten empty soda cans for a penny each but then paid a dime to get rid of her dozen candy wrappers, what would she have? A stomachache!)
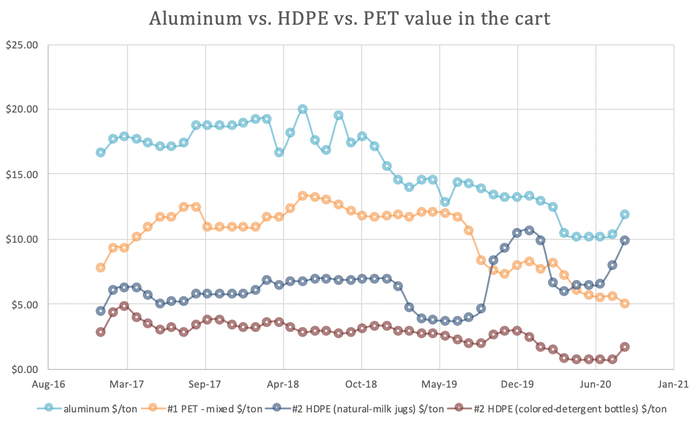
Despite aluminum losing its top spot to natural HDPE from a commodity valuation standpoint, aluminum still stands tall among containers, albeit barely, when considering the makeup of the cart. See the graph below.
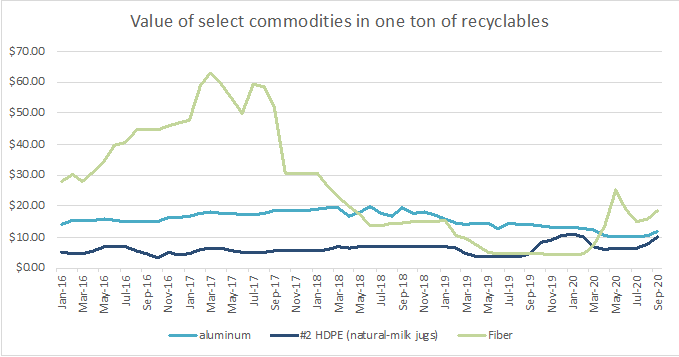
And while aluminum has always been top dog in the cart as far as commodity value is concerned, it is not the most valuable item in the cart. Fiber traditionally made up the foundation of the recycling cart, providing most of its value. That is until export markets collapsed. Only recently, with the advent of the pandemic, have fiber markets recovered to once again overtake aluminum. At the beginning of the year, fiber had some of its lowest values ever with cardboard at $25/ton and mixed paper in negative territory. Given that, it remains to be seen whether this will hold as businesses reopen generating materials that might supplant curbside fiber.
So, what is the current blended value of the cart? The chart below of blended value shows that we appear to be past the low point. But, as can be seen, a significant portion of the increase is can be attributed to increases in fiber values – which may not continue after we return to normal – if we return to normal.
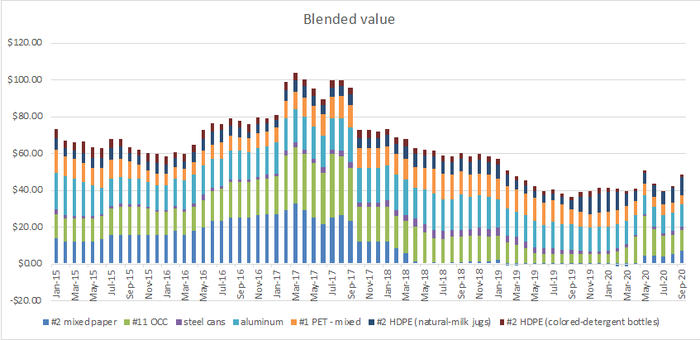
As pressure mounts for increasing recycled content in order to support the circular economy, demand for containers is anticipated to increase with a subsequent increase in commodity values. Unfortunately, not yet. While it’s true that natural HDPE has had some increases this year, this summer container prices were at a lower level than at any time over the past ten years.
For too long, recycling has been focused on the supply side. Regulations were enacted specifically to increase supply with the belief that if you collect, they will buy it. As we’ve learned, that is not always the case. Demand is necessary to offset the supply. Commitments for recycled content are being made by manufacturers. Laws, such as California’s AB-793 requiring 50% post-consumer content by 2030, are being passed. But more still needs to be done to ensure that recycling is not just environmentally sustainable but economically sustainable as well.
About the Author
You May Also Like

