Stifel: Top 10 Trends in 10 Years in Solid Waste
A look at Stifel’s roundup of top 10 trends in solid waste over the next 10 years.

Tight labor markets, the rapid influx of mobile Internet of Things and state-level, climate change-driven policies are dictating immediate action in solid waste, according to a new report released by Michael E. Hoffman, managing director and group head of diversified industrials at Stifel.
The report, “Top 10 Trends in 10 Years in Solid Waste: EV, AV, Recycling and Landfill Trends,” details the top 10 trends in solid waste over the next 10 years.
According to the report, the process of collecting and disposing of trash—landfill, recycling, composting and energy conversion (waste-to-energy (WTE), anaerobic digesters, bioreactors)—is about one stop at a time with a focus on route density and internalization, which supports sustainable pricing leverage and maximizing cash-on-cash returns.
“The equipment to do this is more sophisticated and complex today, but basic operating concepts are the same, with a focus on safety, service quality and route density,” the report points out. “Our Top 10 in 10 list in 2020 has some common elements to prior years, some changes or new.”
Here is Stifel’s roundup of the top 10 trends in solid waste over the next 10 years:
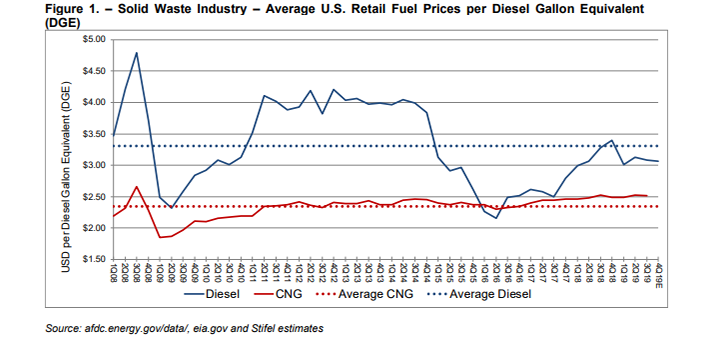
1. Alternative-fueled collection vehicles: Electric vehicle (EV) powertrain could make up 50 percent of the fleet before compressed natural gas (CNG) does. That would mean easy access to refueling if the economics/routing mileage become at least as attractive against CNG.
For instance, a garbage truck works 10 to 12 hours a day and covers 50 to 100 miles in a day. A diesel truck has nearly unlimited options to refuel while on route. CNG does not, and it appears the natural gas industry has missed an opportunity, according to the report.
“To be fair, transportation fuel-based natural gas demand is less than 5 percent of total demand. Spending on refueling infrastructure is not a priority,” the report states. “If EV can get the truck capital cost down and hours of service costs in line with CNG and diesel, the fuel and maintenance savings would dwarf both diesel and CNG. That is the catalyst for EV penetration to surpass CNG.”
2. Autonomous vehicles: Currently, Level 4 or 5 autonomy is limited to off-road autonomous vehicle (AV) applications. Level 3 or 4 autonomy is possible on routed vehicles, which helps address labor pressures.
“The local regulatory challenges to successfully put on the road Level 5 (L-5) fully autonomous garbage trucks in either residential or commercial collection virtually assures this level and type of autonomy is at best decades away, and in our view, L-5 never happens,” according to Stifel.
Alternatively, can AV-like technology (L-2 with lane assistant or collision avoidance up to L-4 with technology-assisted driving/productivity) be used in residential markets to maximize productivity? The truck is delivered to the route by a driver/technician and then the computer takes over running the route as well as the automated side loading robotic arm.
The report also notes that in fiscal year 2020, Waste Connections will test advanced driver-assistance systems in three U.S. markets.
In addition, there are several applications at the landfill where full L-4/L-5 AV equipment can and should be readily deployed, including landfill compacting vehicles and bulldozers that work the face of the landfill cell.
3. Little brown box volume: Old corrugated containers (OCC) volume stalls as a shift away from the box-in-a-box packaging offsets the share gains of internet buying versus brick-and-mortar buying.
“We all can relate to the volume of little brown boxes coming to our homes as more and more of our purchasing moves online,” the report notes. “Interestingly, consumers still do more than 80 percent of buying in brick-and-mortar stores, but that trend continues to gradually shift to more online as evidenced by about 9,100 brick-and-mortar store closures in FY19.”
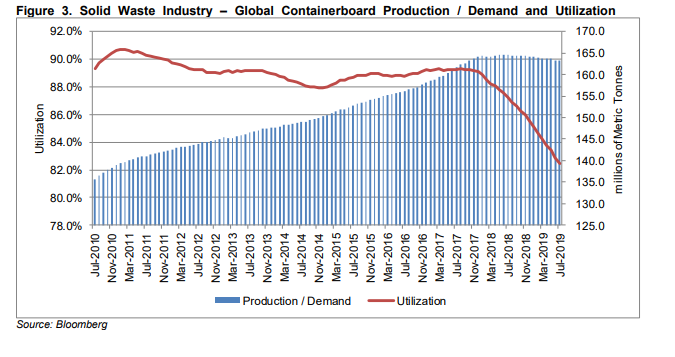
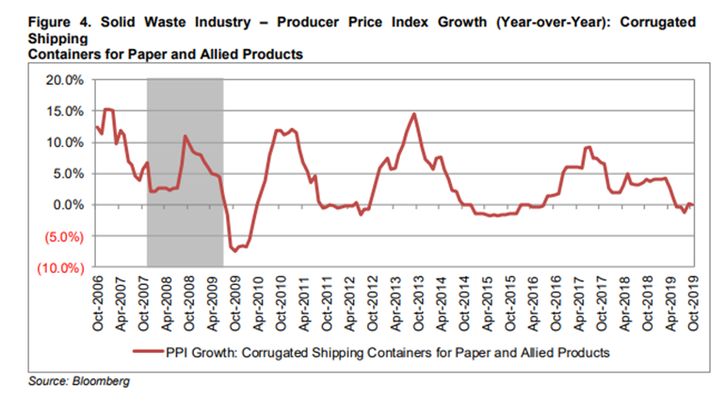
4. Recycled paper: Domestic content commitments help drive domestic and international paper producers to shift nearly all (OCC and mixed waste paper) recycling fiber to domestic paper mills.
“The knock-on consequences of National Sword driving down recovered fiber price has been compounded by a global oversupply of paper broadly in 2019 with no relief in sight,” according to the report. “Paper prices are likely going to stay low for a while.”
“China has 26 million to 30 million tons of paper-making capacity. It cannot grow pulping trees economically. It has to use either imported pulp or recovered fiber—internally sourced or imported,” the report points out. “The contamination limits and possible future outright ban on all recovered material imports mean paper makers have to come up with a plan B for sourcing quality feedstock.”
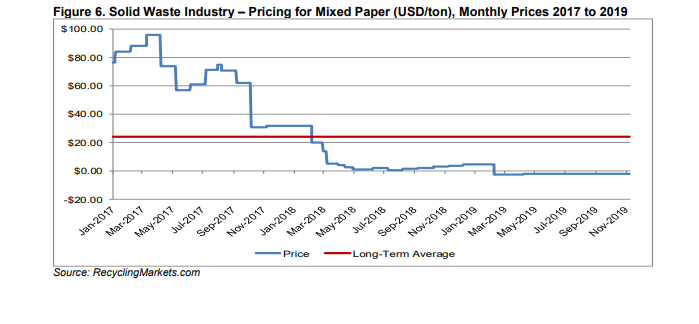
5. Recycling contamination: Taxpayers revolt and agree to shift household recycling to only corrugated boxes, plastic bottles with a neck, all cans (beer and soup), NO GLASS or single-use plastics/packaging.
In the past 10 years, as single stream recycling dominated curbside recycling collection, the quality of what is collected has steadily deteriorated, the report explains.
“The root of this problem is manifold,” according to Stifel. “The service sector recognizes it needs to retake ownership of consumer education. The politicians/bureaucrats are not being candid with taxpayers about the state of recycling and what is needed to sustain an economically viable program.”
Then there is aspirational recycling, where consumers rely on the international recycling symbol to decide whether to put something in the curbside bin. In some cases, Stifel notes, an item is recyclable, but not via curbside—take lithium-ion batteries, for instance.
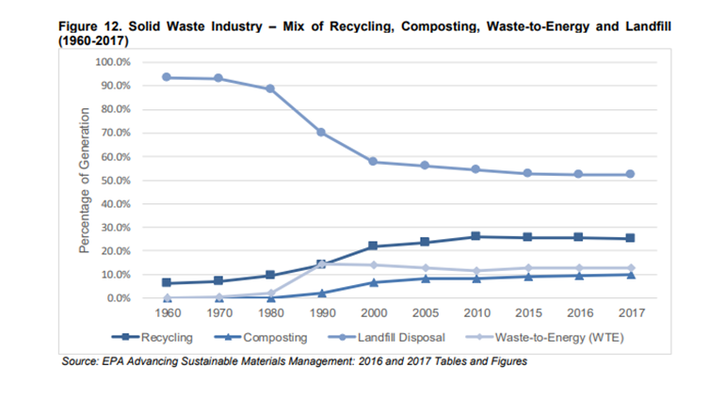
6. Post collection: Recycling stalls at 25 percent, but the quality is superior with more relevant circular economic benefit. Composting and WTE remain at about 10 percent each, while landfill remains at roughly 55 percent.
According to Stifel, as service companies change the recycling relationship from commodity-based to a process fee and contamination charge and retake ownership of consumer education, the quality of the recycling collected at the curb should improve. Additionally, more focus will be on what is truly circular now and whether it can be economically reused. That increases overall good volume as well, the report notes.
7. Organic diversion/recycling: This is not economical without subsidies—ever, according to the report. As Stifel points out: “Can you say landfill gas?”
According to the report, in 10 years, the probability of a viable solution to economically capture the energy value of organic waste—specifically food waste—still will not be able to address all of the following questions: Does it work? Can it be scaled? Is it economical without subsidies? Is there a favorable regulatory backdrop?
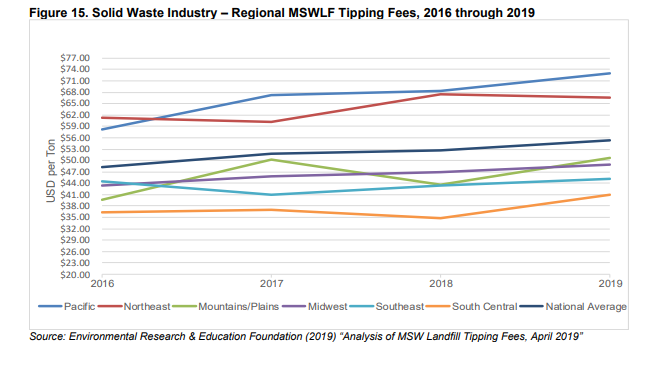
8. Total MSW landfills: Landfills in operation are expected to decline another 20 to 25 percent, which leads to average tip fees rising from $55 per ton to $80 per ton.
According to the report, there are about 1,269 non-hazardous waste landfills in the U.S. with about half controlled by 25 companies, of which two-thirds of that group are controlled by the five public companies. Stifel says it expects small private and mid-to-small municipal landfills to close at a steady pace over the next decade. Drivers include a lack of land to expand and the rising cost of managing leachate and financial assurance obligations—closure and post-closure obligations.
“In 10 years, we think total non-hazardous waste landfills (Subtitle D) will be down to 900 to 1,100,” the report states. “In urban markets, if there are three to four landfills on average today, the trend is likely for at least one landfill to come out of the market over 10 years.”
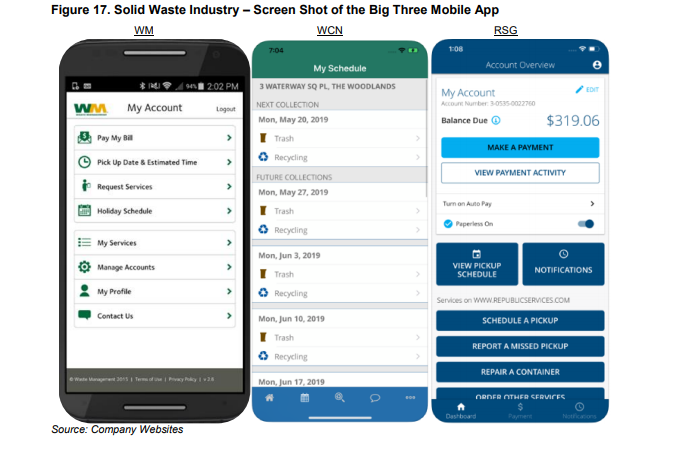
9. Technology: “Helps deliver better end-to-end connection with the customer—doesn’t everyone want a mobile garbage app?” emphasizes Stifel.
“With a mobile app, the solid waste service provider can put out an alert and the customer can ‘Google-like’ ask the question and get that answer without a live call,” Hoffman points out in the report. “Think about changing the dialog in recycling to get the homeowner to focus on just OCC, plastic bottles with a neck and all cans, or emphasizing NO GLASS or single-use packaging. How much of a favorable impact on contamination could a mobile app produce?”
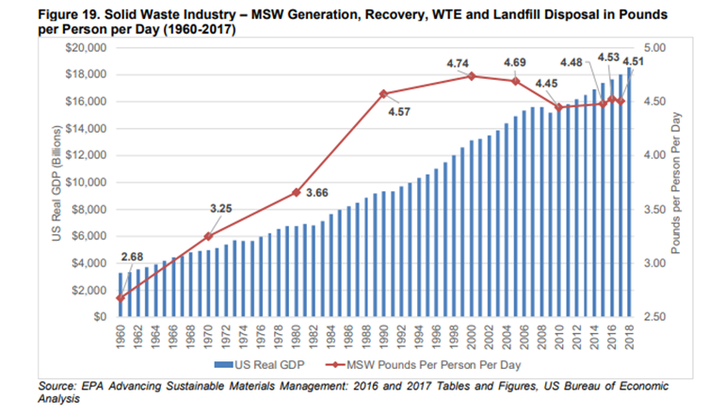
10. U.S. solid waste generation: In 2017, one person generated 4.51 pounds of waste per day. That is up from 4.48 pounds per person per day in 2015.
“A healthy economy and continued use of single-use packaging helped lift waste generation per person to 4.51 pounds per day,” according to Stifel. “The growing presence of little brown boxes and the consumption of regularly used products in small quantities should keep the average daily production of waste per person at least constant, and maybe even expand it, too.”
About the Author
You May Also Like


