Top 10 Trends in Solid Waste Over the Next 10 Years

Stifel released its latest solid-waste industry update, “Top 10 Trends in 10 Years in Solid Waste: Technology Is Now Table Stakes But Does Not Disintermediate the Business Model.”
The financial-services company has published such a list for several years now, and this year’s repeats several trends from last year, combined a couple, dropped some, and added some new.
One of the authors, Michael E. Hoffman, notes that, “The big theme underlying the revisions to the list – how much solid waste has embraced digital/technology to alter the fundamental structure of the business model but acknowledges technology has limits.”
Four of the identified trends appear on the list for the first time (numbers 5-7 below), and several returned with an expanded or altered view (numbers 3, 4, and 8 below), The authors elaborate on each trend through data, analysis and commentary. Also included is a 2022 solid waste stock outlook.
The trends, and one key takeaway from each, are as follows:
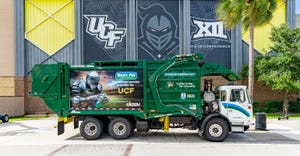
Alternative fueled vehicles: Solid waste led on CNG with nearly 30% of the total fleet converted. The next big move is EV (electric vehicle) with the total routed fleet at 50% converted, a combination of CNG and EV, with EV overtaking CNG within the mix. However, the capital cost, hours of service and weight limitations have to become more competitive with CNG and Diesel.
Based on stated commitments solid waste is prepared to embrace fully electric routed vehicles (EV). The current limitation is hours of service (HOS – battery life) and payload. A routed vehicle needs to operate for 10-11 hours without needing to refuel. The payload trade-off today is about 3,000 pounds or 10% to 20% reduction of the legal payload of a diesel/CNG equivalent. The vehicle is meaningfully more expensive (nearly twice) but we expect the cost differential narrows significantly once manufacturing capacity for EV expands and economies of scale can be brought to bear.
Post Collection: Total number of landfills decline to fewer than 1,000 down from just below 1,300, and with the drop comes a rise in the national average tip fee to more than $75/ton (a 3.5% annual increase).
There are about 1,280 active non-hazardous waste landfills in the US, about half of which are controlled by 25 companies (and two-thirds of that group are controlled by the five public companies). We expect small private and small- to mid-sized municipal landfills to close at a steady pace over the next decade. The drivers of this trend are a lack of land to expand and the rising cost of managing leachate and financial assurance obligations – the closure and post closure obligations. PFAS restrictions on managing leachate will only exacerbate the cost of operations.
Recycling business model: Big Solid Waste saves Recycling. There are about 800 existing MRFs. To meet the demand for more and better quality output at least a $2 billion modernization is needed.
There are two points of change in the business model – the collection of recyclables and what is charged to do so and the processing of recyclables at material recovery facilities (MRF). The municipal collection contract revisions to reflect the processing cost charged to collect and offload the recycling collection is nearly 50% complete. We estimate the remaining contract terms will be addressed in the normal course of contract renewals, which could take another three to five years.
Technology/Digital: A digital connection to all stakeholders has become table stakes, coupled with use of technology to address replacing low skilled/repetitive tasks to deal with labor pool constraints.
The pandemic forced the economy into more technology interface not less and the consumer is not giving that back. The clear winners broadly, other than the SAAS (software as a service) companies are businesses that made the digital interface relevant and easy to use.
Extended Producer Responsibility (EPR): No nationwide EPR program, but state programs expand in predominantly Blue states and look more like the Canadian model rather than either Oregon or Maine programs.
We do not see a national EPR mandate. That is probably a hill too tall for the US Congress to want or even to successfully climb and produce effective legislation. Instead this will be taken up at the state level. Oregon and Maine have passed legislation. They have taken two very different approaches. Oregon and producers are splitting the funding accountability, while Maine puts the onus on the producers but specifically exempts paper products.
Collection at the loading dock and curb: The scope and source of waste generation does not change and neither does how the waste is collected one stop at a time, in small increments. Technology automates more collection, drives dynamic routing and pick-up on demand where practical but otherwise the equipment does not change meaningfully.
Technology will lead to better routing, less labor and increased safety. It does not change the fact that thousands of individual pickups happen every day. Nor is there a technology that exists today that will alter the collection model. Technology helps ameliorate the labor pool constraints and could expand the size of the addressable labor pool if used to accommodate changes in the cab to expand the role of women drivers now about 10% of the direct labor force today.
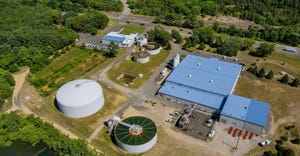
Landfill Gas (LFGTE)/Organics: Solid waste produces nearly 11mm MWh of baseload power into the Grid today from about 480 low/ medium Btu LFGTE systems. The next move is to convert legacy high volume and develop new high volume sites to Hi-Btu facilities that produce renewable natural gas. At the same time, nothing meaningful will happen with Organics diversion until a technology exists that works, is scalable and economic on its own merits.
We suspect Solid Waste will continue to mostly outsource its Low/Medium Btu LFG development and take a royalty. The Hi-Btu could be a wholly owned and or developed with a partner. Operating a LFG plant is unique enough that outsourcing/ partnering with an operator/developer makes a lot of sense.
Consolidation: There may be six or seven before there is another round of “big” consolidation: While above average pace of M&A persists with lots of tuck-ins and some new market entries for the consolidators, eventually some consolidation, at the top, is likely. Before that happens, one or two more private equity/infrastructure investments may turn to the public markets as the exit.
In our view the whole solid waste group will continue to peruse consolidation at about the pace of the industry organic growth, or 2% to 3% of acquired sales for each company. We believe WCN and GFL are the best positioned for one more big deal – public (CWST) or private. However, in the next 10 years in our view, do not count out a RSG combination with WCN or GFL, Both would result in divestments but recall RSG has not exposure in Canada and WCN and GFL are more concentrated in secondary than primary markets compared to RSG.
PFAS — Solid Waste is a solution: The modern Subtitle-D landfill successfully captures billions of gallons of leachate annually, often with complex tiered PH changes needed and a recurring presence of PFAS from the waste stream; it is the obvious choice for containing PFAS in an environmentally sound manner.
Solid Waste landfills processes billions of gallons of leachate, which often requires a three PH level processing, making it some of the most complex industrial waste liquids to treat. About two-thirds of leachate are managed offsite in POTW (publically owned treatment works) and the remainder onsite through evaporation ponds or direct processing. POTW’s produce sludge, which has high concentrations of PFAS (even before accepting landfill leachate). About half of POTW sludge has been land-farmed for the nutrient value in the sludge. That policy is likely to come to an end.
U.S. solid waste generation: About five pounds per person despite some WFH volume shift is now structural.
Since the peak impact of the COVID-19 pandemic passed and people adjusted to the work-from-home (WFH) shift, solid waste volumes recovered in 2021, with all the public waste companies reporting positive FY21 year-over-year volume growth ranging from 1.6% to 3.4% with a simple average of 2.6% and median 2.8%. Residential volumes have normalized at a higher level post the WFH boost and commercial volumes are entering FY22 at or above FY19 levels.
About the Author
You May Also Like


